
AirAudit Mathodology
Home » Our Audit Methodology

A Rigorous Methodology Built for Industrial Reality
250+
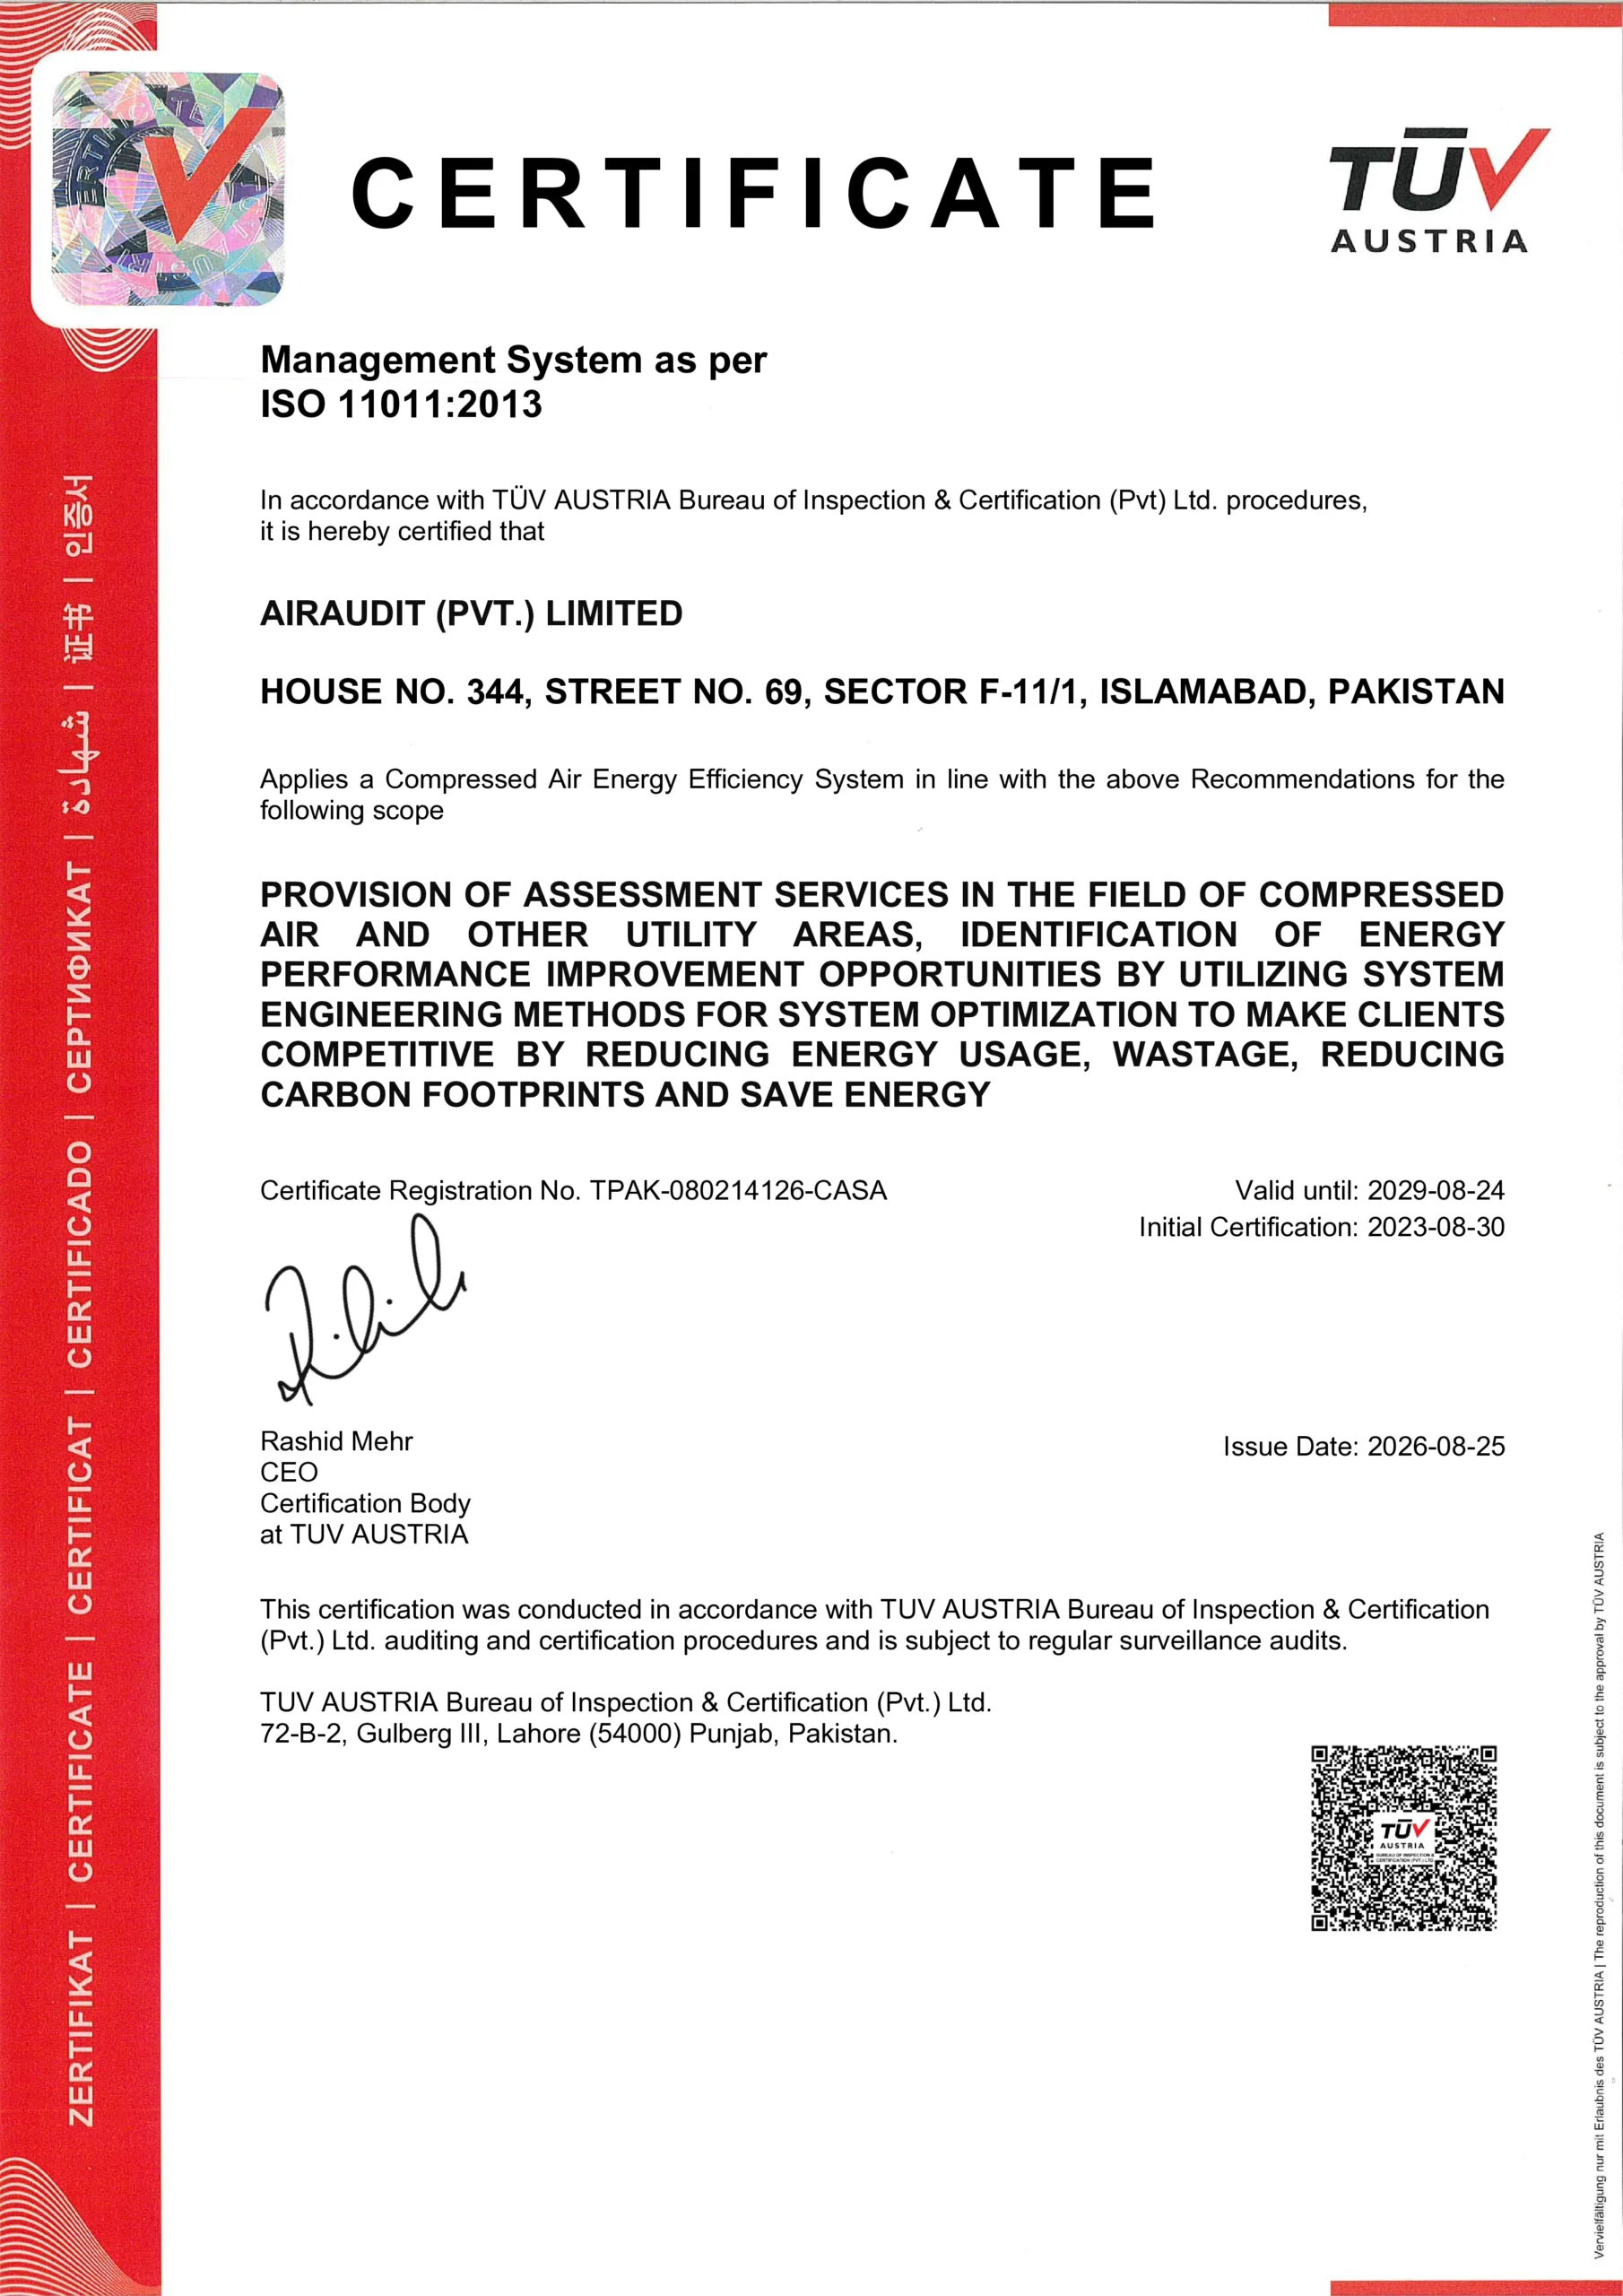
ISO 11011
97%
13 Yrs
Three Audit Levels, One Consistent Standard
Walk-Through Assessment
- 1–2 days on-site
- Plants up to 75 kW
Full System Audit
- 3–7 days on-site
- 75 kW – 500 kW
Investment-Grade Audit
- 7–14 days + monitoring
- 500 kW+ / Multi-site
Why ISO 11011 Matters for Your Business
Eight Stages, One Continuous Line from Data to Decision
Pre-Audit Data Collection & System Familiarisation
Before any instrument is unboxed, the audit team reviews the client's compressor inventory, maintenance records, utility bills, production schedules, and any existing system drawings. We send a structured pre-audit questionnaire covering compressor specifications, operating hours, recent modifications, and known issues — establishing the theoretical demand profile and identifying highest-risk areas for investigation.
- Compressor inventory baseline
- Theoretical load profile
- Priority investigation list
- Site access plan
Supply-Side Measurement — Compressor Performance
Field instruments measure actual compressor output, power consumption, and efficiency against rated specifications. We measure specific energy consumption (kW per m³/min of free air delivered), compare against manufacturer curves, and identify whether any deficit is driven by inlet conditions, oil contamination, bearing wear, or control system misconfiguration.
- Actual vs rated output (%)
- Specific energy (kW/m³/min)
- Compressor health assessment
- Control system review
Demand-Side Survey — Points of Use & End Applications
Compressed air is expensive. Many industrial facilities apply it to applications where alternatives — electric motors, vacuum systems, or improved tooling — would cost a fraction of the energy. This phase maps every point of use and assesses whether compressed air is the appropriate technology and whether it is being used at the correct pressure. Incorrectly specified applications can represent 15–25% of a facility's total compressed air cost.
- Points-of-use register
- Application efficiency rating
- Inappropriate use identification
- Pressure requirement mapping
Leak Detection & Quantification
Using calibrated ultrasonic detection equipment, every accessible section of the distribution network is surveyed for leaks. Each leak point is logged by location, estimated flow rate (CFM), decibel reading, and repair priority. In most industrial facilities, leaks account for 20–30% of total compressed air production. Every leak is assigned a repair cost estimate and an annual savings value, enabling the maintenance team to prioritise interventions by return on repair cost.
- Georeferenced leak log
- Total leakage (CFM / m³/min)
- Annual cost of leakage (USD/PKR)
- Prioritised repair schedule
Distribution Network Analysis — Pressure, Flow & Piping
The piping network between compressor and point of use introduces friction losses, pressure drops, and contamination risks that compound energy waste. We measure pressure differential across the full distribution system, identify where losses are concentrated, and assess whether pipe sizing, configuration, material, and layout are appropriate for the facility's current demand profile. Converting a dead-end configuration to a ring-main typically delivers payback within one operating year.
- Pressure drop profile (full network)
- Flow balance assessment
- Pipe sizing and material review
- Layout reconfiguration options
Analysis, Reporting & Recommendations
All field data is consolidated and analysed against the ISO 11011 framework at our Pakistan head office. The audit report is a costed action plan — each recommendation assigned a savings value, implementation cost, and simple payback period in months. The report covers an executive summary for management, technical findings for engineering teams, and a prioritised action table for maintenance planning. An ESG-compatible savings summary is also prepared for clients with sustainability reporting obligations.
- ISO 11011 audit report
- Prioritised action table with ROI
- Capex avoidance analysis
- ESG-compatible savings summary
- Baseline for future comparison
Calibrated Instruments, Not Approximations
| Instrument | What It Measures | Why It Matters |
|---|---|---|
| Ultrasonic Leak Detector | Leak location and relative magnitude across the full distribution network | Finds leaks invisible to the eye and inaudible to the ear — the majority of industrial leak points are in this category |
| Thermal Mass Flow Meter | Actual volumetric flow rate (m³/min, CFM) at measurement point | Establishes whether supply matches demand and quantifies losses between compressor outlet and points of use |
| Power Quality Analyser | True electrical power consumption (kW), power factor, and harmonic profile of compressor drives | Converts efficiency losses from percentages into PKR/USD annual costs that management can act on |
| Dew Point Meter | Moisture content of compressed air at critical measurement points | Identifies moisture ingress that damages pneumatic tools, contaminates product in food/pharma processes, and corrodes distribution pipework |
| Calibrated Pressure Gauges | System pressure at multiple points across the distribution network | Maps pressure differential to identify where friction losses are concentrated and quantifies the energy cost of over-pressurisation |
| Infrared Thermometer / Thermocouple | Compressor inlet and discharge temperatures, ambient room conditions | High inlet temperatures (common in poorly ventilated compressor rooms) directly reduce compressor efficiency — 3°C above optimum costs approximately 1% in output |
| Data Logger | Time-series pressure, temperature, and flow — unattended, over a full production cycle | Captures demand variation, unplanned shutdowns, and shift-change pressure drops that a single-point measurement would miss entirely |